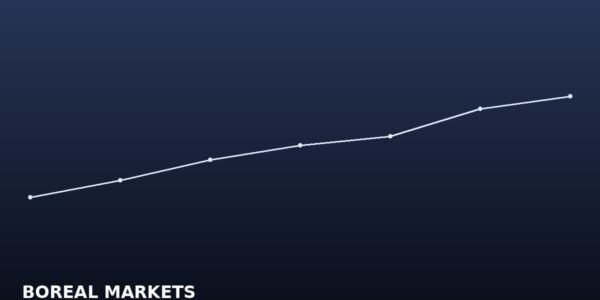
- Silver rose 0.95% to $67.19 USD ($94.13 CAD) per ounce on September 21, 2026, diverging bullishly from a softer gold market.
- The gold/silver ratio of 65.4x remains above its 55x historical average, implying potential silver upside of roughly 18% on mean reversion.
- The Silver Institute estimates the 2025 global silver supply deficit at 182 million ounces, driven by record photovoltaic manufacturing demand of 232 million ounces.
- TSX-listed First Majestic Silver (FR) is expanding margins sharply at current spot prices, with AISC near $20.50/oz and management flagging a potential special dividend.
Silver extended its rally to $67.19 USD ($94.13 CAD) per ounce on Monday, September 21, 2026, gaining 0.95% on the session as industrial buying absorbed any macro headwinds from a softer gold market. While gold slipped 0.66% to $4,395.90/oz, silver’s divergence highlighted a key theme playing out across commodity desks: the metal’s industrial identity is increasingly outrunning its monetary one.
The Gold/Silver Ratio Signals Room to Run
The gold/silver ratio — calculated by dividing gold’s price by silver’s — currently sits at approximately 65.4, down from above 80 just two years ago but still historically elevated relative to the long-run average near 55. Precious metals analysts have long treated a contracting ratio as a bullish signal for silver’s relative performance. With gold pressing all-time highs above $4,300/oz, a reversion toward the 55x historical mean would imply silver prices well above $79/oz USD — nearly 18% higher than today’s level. That asymmetry is drawing attention from both momentum traders and long-term resource investors.
Solar Panels Are Eating Silver Supply
The Silver Institute’s most recent annual report flagged a fourth consecutive annual supply deficit in the global silver market, with the 2025 shortfall estimated at 182 million ounces — one of the largest on record. Photovoltaic cell manufacturing has become the single fastest-growing source of industrial silver demand, accounting for an estimated 232 million ounces in 2025 alone, up more than 20% year-over-year as next-generation TOPCon and perovskite solar architectures use significantly more silver per cell than legacy PERC panels. EV powertrains and consumer electronics add a further structural floor beneath prices. Mine supply, meanwhile, has failed to keep pace: output from top producers in Mexico and Peru has been constrained by permitting backlogs, water-use restrictions, and community opposition, leaving the market chronically undersupplied.
First Majestic Silver Positioned to Capitalize
Among Canadian-listed silver producers, First Majestic Silver Corp. (TSX: FR) remains the most direct pure-play expression of the silver price on the TSX. The Vancouver-headquartered miner operates three producing mines in Mexico — San Dimas, Santa Elena, and La Encantada — and reported second-quarter 2026 silver equivalent production of approximately 6.8 million ounces, with all-in sustaining costs (AISC) running near $20.50/oz silver equivalent. At $67.19 spot, First Majestic’s operating margins have expanded dramatically, and management has flagged potential for a special dividend should silver sustain levels above $65/oz through year-end. The stock has been a notable outperformer on the TSX in 2026, reflecting both the higher silver price and investor appetite for leveraged exposure to the metal.
Price Levels to Watch
From a technical standpoint, silver’s next meaningful resistance sits at the $69.50 USD level, which corresponds to the March 2026 swing high. A clean break above that zone would open a path toward the psychologically significant $75/oz mark. On the downside, the $63.00–$64.00 USD band has acted as a durable support floor since June, underpinned by physical buying from Indian and Chinese fabricators. With copper also surging 3.22% to $6.83/lb on the same session — a signal of broad industrial metals strength — the macro backdrop for silver’s dual-identity narrative looks increasingly constructive heading into the final quarter of 2026.
| Metal / Pair | Price | Change |
|---|---|---|
| Silver (USD/oz) | $67.19 | +0.95% |
| Silver (CAD/oz) | $94.13 | +0.95% |
| Gold (USD/oz) | $4,395.90 | -0.66% |
| Gold/Silver Ratio | 65.4x | — |
| USD/CAD | 1.4010 | — |