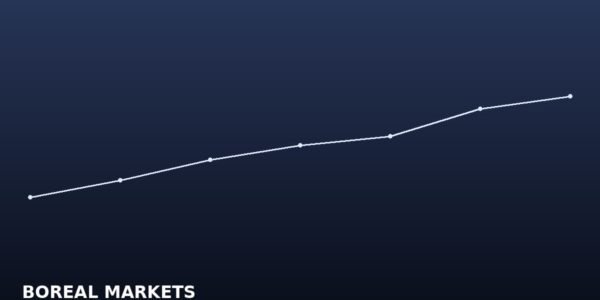
- Silver dropped 3.66% to US$47.23/oz (C$67.34) on November 16, 2026, its sharpest single-session decline in six weeks.
- The gold/silver ratio widened to 82:1 — well above the historical average of 65:1, historically a bullish setup for silver outperformance.
- The Silver Institute projects a fourth consecutive annual supply deficit in 2026, with the cumulative shortfall since 2023 surpassing 600 million ounces.
- Toronto-listed First Majestic Silver (TSX: FR) remains a primary Canadian equity vehicle for silver exposure, with AISC near US$18–20/oz silver-equivalent.
Silver fell $1.80, or 3.66%, to US$47.23 per ounce on November 16, 2026 — equivalent to C$67.34 at the prevailing USD/CAD rate of 1.4258 — as a broad commodity selloff dragged the metal below key technical support at US$48.00. The drop was the sharpest single-session decline in six weeks, but analysts are cautioning retail investors not to confuse a macro-driven down day with a change in silver’s underlying supply story.
Gold/Silver Ratio Widens to 82x — Historically Cheap Territory
With gold easing only 0.37% to US$3,872.10 per ounce on the same session, the gold/silver ratio widened to approximately 82:1 — meaning it now takes 82 ounces of silver to buy one ounce of gold. Historically, the ratio has averaged closer to 65:1 over the past decade, and each prior spike above 80 — in 2016, 2018, and the COVID shock of 2020 — was followed by silver outperforming gold during the recovery phase. A reversion to a 70:1 ratio at current gold prices would imply silver trading near US$55.30, roughly 17% above Monday’s close.
Industrial Demand: Solar Panels Are Eating Silver Supply
The Silver Institute’s 2026 World Silver Survey projected global silver demand at a record 1.46 billion ounces for the full year, driven overwhelmingly by photovoltaic (PV) solar-cell manufacturing. Each new generation of high-efficiency TOPCon and perovskite solar panels uses more silver per cell than the PERC panels they replace — a trend that has added an estimated 60–70 million additional ounces of annual industrial demand since 2023. EV power electronics and 5G infrastructure contribute a further layer of structural consumption that did not exist at scale five years ago.
Mine supply, meanwhile, is not keeping pace. The Silver Institute flagged a structural market deficit for the fourth consecutive year in 2026, with the cumulative shortfall since 2023 now exceeding 600 million ounces — a gap that has been partially filled by above-ground inventory drawdowns, but those reserves are visibly shrinking. Any sustained supply disruption in top-producing nations — Mexico, Peru, or Chile — could accelerate the squeeze.
First Majestic Silver: A Canadian Lens on the Opportunity
Toronto-listed First Majestic Silver (TSX: FR) is one of the most direct Canadian equity expressions of silver’s structural thesis. The company operates primary silver mines in Mexico and Nevada, and its revenue is highly leveraged to the silver price — roughly 55–60% of net revenue is derived from silver, with gold and base metals making up the balance. At US$47.23 silver, First Majestic’s realized margins remain healthy relative to its reported all-in sustaining cost (AISC) of approximately US$18–20 per silver-equivalent ounce.
Pan American Silver (TSX: PAAS) and MAG Silver (TSX: MAG) round out the Canadian silver producer landscape. MAG Silver, still in the ramp-up phase at the high-grade Juanicipio mine in Mexico — a joint venture with Fresnillo — offers a more leveraged, development-stage profile for investors with higher risk tolerance.
Key Price Levels to Watch
| Level (USD/oz) | Significance | CAD Equivalent |
|---|---|---|
| $48.00 | Broken near-term support; now resistance | C$68.44 |
| $47.23 | November 16 close | C$67.34 |
| $45.50 | 200-day moving average (est.) | C$64.87 |
| $55.30 | Gold/silver ratio reversion target (70:1) | C$78.85 |
Monday’s pullback is uncomfortable but not structurally alarming. Four straight years of supply deficits do not reverse in a single session. The case for silver rests on a foundation of compounding industrial demand and constrained mine supply — and a widening gold/silver ratio historically has been the setup, not the deterrent, for silver’s next leg higher.